Monitoring
Monitoring in Adeptia gives you a live view of how your integrations are running, so you can quickly understand what is working, what has failed, and why.
What monitoring covers
Adeptia monitoring spans the full lifecycle of your integrations, from the moment a trigger fires through every step of data processing to the final delivery. You can inspect activity at several levels of detail:
| Level | What you see |
|---|---|
| Dashboard overview | Execution counts, success and failure rates, trends over time, and a breakdown by transaction type |
| Trigger and event activity | Which triggers fired, which processes they started, and any trigger or event errors |
| Execution history | A list of individual runs with status, timing, and file information |
| Execution detail | A step-by-step breakdown of a single run, including source, processing, and destination steps, with error messages where applicable |
| Transaction detail | The full configuration of a specific automation, including its source and destination applications, partner, trigger, and pipeline steps |
| Workflow list | All configured workflows with their current active or inactive status |
Where: Dashboard Tab in the Adeptia portal sidebar.
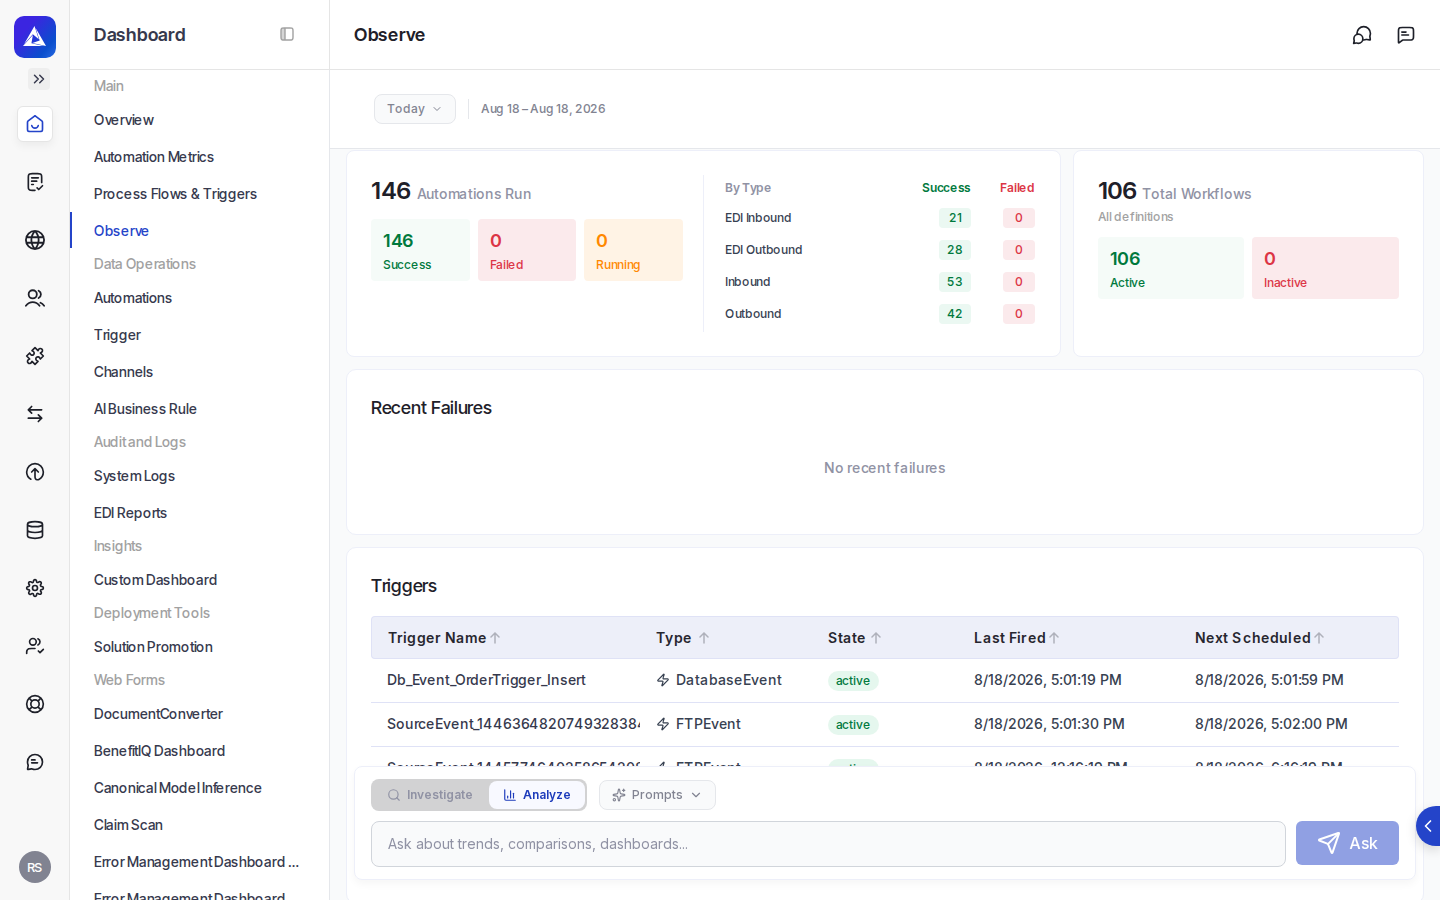
Tracking execution history
The execution history view lists every run across your integrations. You can narrow the list by:
- The name of the transaction or workflow
- Execution status: successful, failed, or currently running
- The partner or trading partner involved
- A date range
When you find a run of interest, you can open its detail view to see exactly what happened at each step, including any error messages that explain a failure. For deeper investigation, you can also request an activity-by-activity audit trail that shows timing and data volumes for each step, as well as the context variables that were active during the run.
Understanding the automation overview
The automation overview dashboard aggregates execution data across a time window you choose, from a single day up to a full year. It shows:
- Total execution counts and how they break down by outcome
- Daily trends so you can spot patterns or anomalies
- A breakdown by transaction type
- Process flow activity
You can focus on specific sections of the dashboard, such as completed executions, pending executions, or trend data, rather than loading everything at once. The dashboard also respects your local timezone so that daily counts align with your business day.
Monitoring triggers and events
The trigger dashboard focuses specifically on event-driven activity. It shows which triggers are currently active, which processes they have recently started, and any errors that occurred at the trigger or event level. This complements the execution overview, which focuses on the outcomes of runs rather than the events that started them.
The trigger dashboard defaults to the last seven days and can be scoped to a custom date range.
Working with transactions and workflows
From the monitoring area you can browse all configured transactions, which are the complete automations that link a process flow to a partner, a trigger, and settings. You can filter by status (active, draft, or inactive), by transaction type (inbound, outbound, or others), or by partner name. Selecting a transaction shows its full configuration, including the source and destination applications, the pipeline steps, and the settings applied.
You can also browse all workflows and filter by status, project, owner, or modification date. Selecting a workflow shows its configuration alongside recent execution statistics.
Diagnosing failures
When an execution fails, the detail view shows the error message for each affected step. For complex failures, the optional audit trail provides a chronological record of every activity in the pipeline, making it straightforward to identify exactly where and why a run stopped.
The monitoring area also provides diagnostic information covering system health, connectivity status, and recent errors.
Filtering and time ranges
Most monitoring views accept a date range so you can focus on a specific period. Execution history supports pagination so you can work through large result sets. The automation overview accepts a timezone setting so that daily breakdowns reflect your local business hours rather than server time.