Execution History
Execution History gives you a complete, searchable record of every integration run in your Adeptia environment, so you can monitor activity, diagnose problems, and verify that data is moving as expected.
What execution history shows you
Each entry in the execution history represents a single run of an integration transaction. For every run, you can see:
| Information | What it tells you |
|---|---|
| Transaction name and template | Which integration ran |
| Status | Whether the run succeeded, failed, or is still in progress |
| Start time, end time, and duration | When the run happened and how long it took |
| Partner name | Which trading partner or counterpart was involved |
| Direction and transaction type | The nature of the data exchange |
| Source and target file details | What data was processed and where it came from or went |
| File size | How much data was transferred |
| User | Who initiated the run |
| Whether the run was a re-run | If the execution was triggered as a retry of a previous attempt |
Filtering and searching your history
You can narrow the execution history to find exactly what you need. Supported filters include:
| Filter | How it works |
|---|---|
| Status | Show only successful, failed, or currently running executions |
| Date range | Limit results to a specific time window by start time |
| Partner | Filter by a specific trading partner, by name or identifier |
| Transaction name | Search by full or partial name |
| Transaction type | Scope results to a particular category of integration |
Filters can be combined, so you can, for example, find all failed runs for a specific partner within a given date range.
Grouping executions to spot patterns
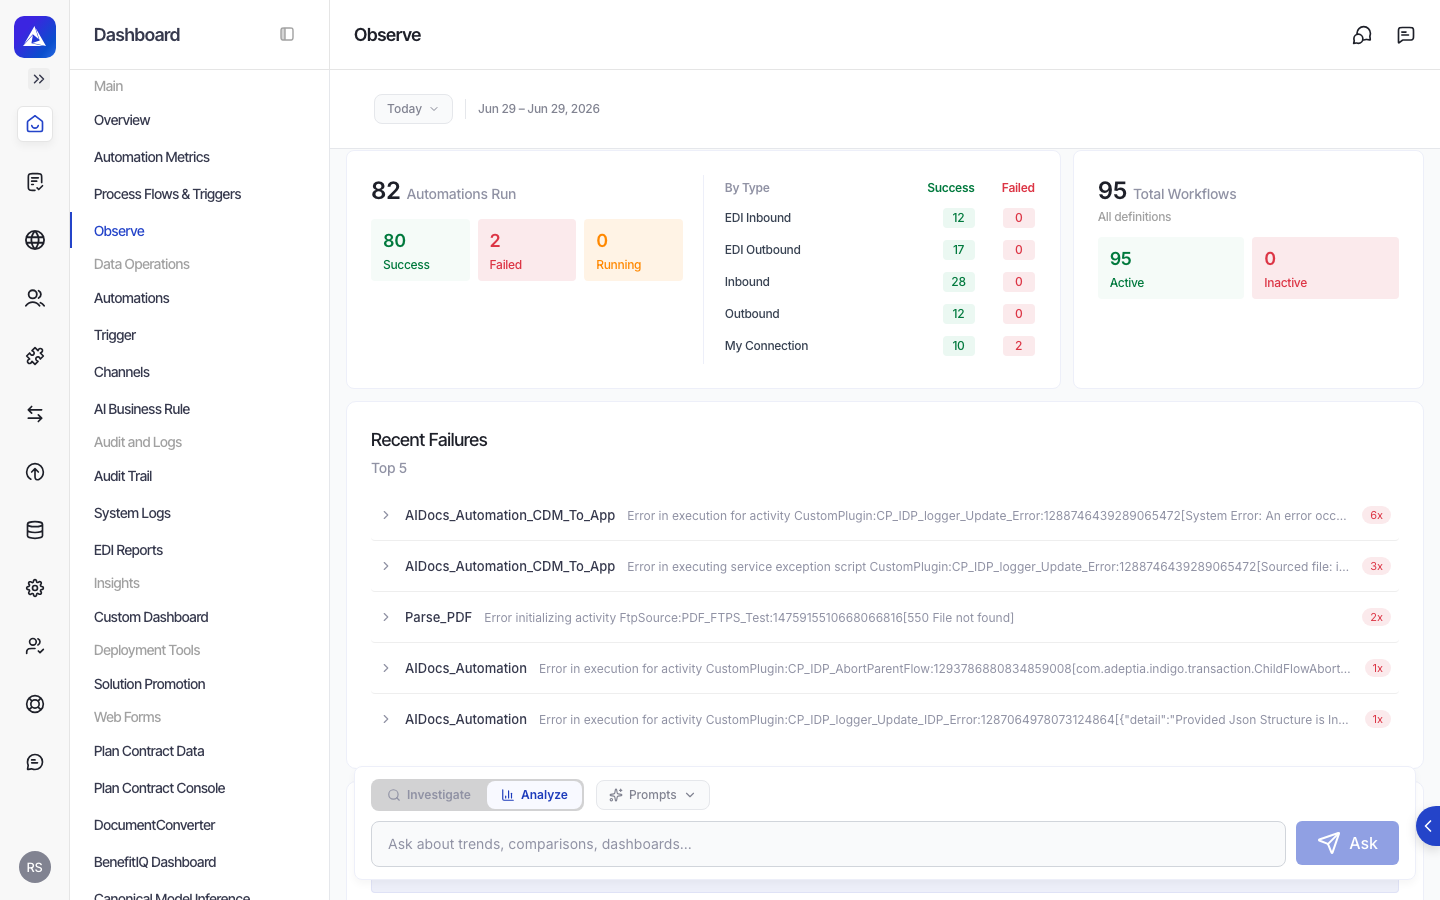
Beyond individual records, you can group executions to surface trends across your history. Grouping is available by:
- Error message - see which errors are occurring most frequently and which transactions or partners they affect
- Transaction name - understand which integrations are running most or failing most
- Partner name - identify which partners have the most activity or the most issues
Each group shows a count of matching executions, when the most recent one occurred, and which transactions and partners are involved.
Drilling into a single execution
Individual execution records include a detailed breakdown of the three stages of the integration run: the Source step, the Adeptia step, and the Destination step. For each stage you can see whether it succeeded or failed, and any error message associated with a failure.
Audit logs and context information
For deeper investigation, you can request additional detail alongside the execution record:
- Audit logs provide an activity-by-activity trail of everything that happened during the run, including the name and type of each activity, its status, timing, data volumes processed, and any error messages.
- Context information surfaces the runtime variables that were in effect during the execution, presented as a list of name-value pairs.
These enriched views are particularly useful when a run fails and you need to understand exactly where and why it broke down.
How execution history fits into your workflow
Execution History is most useful in two situations. During development and testing, it lets you confirm that a new integration is processing data correctly end to end. In production, it serves as your primary tool for monitoring ongoing activity, catching failures quickly, and gathering the information you need to resolve issues.