Automations
The Automations dashboard gives you a live view of every integration running in your Adeptia environment, so you can quickly confirm that data is flowing, spot problems before they affect your business, and investigate failures in detail.
Where: Dashboard Tab
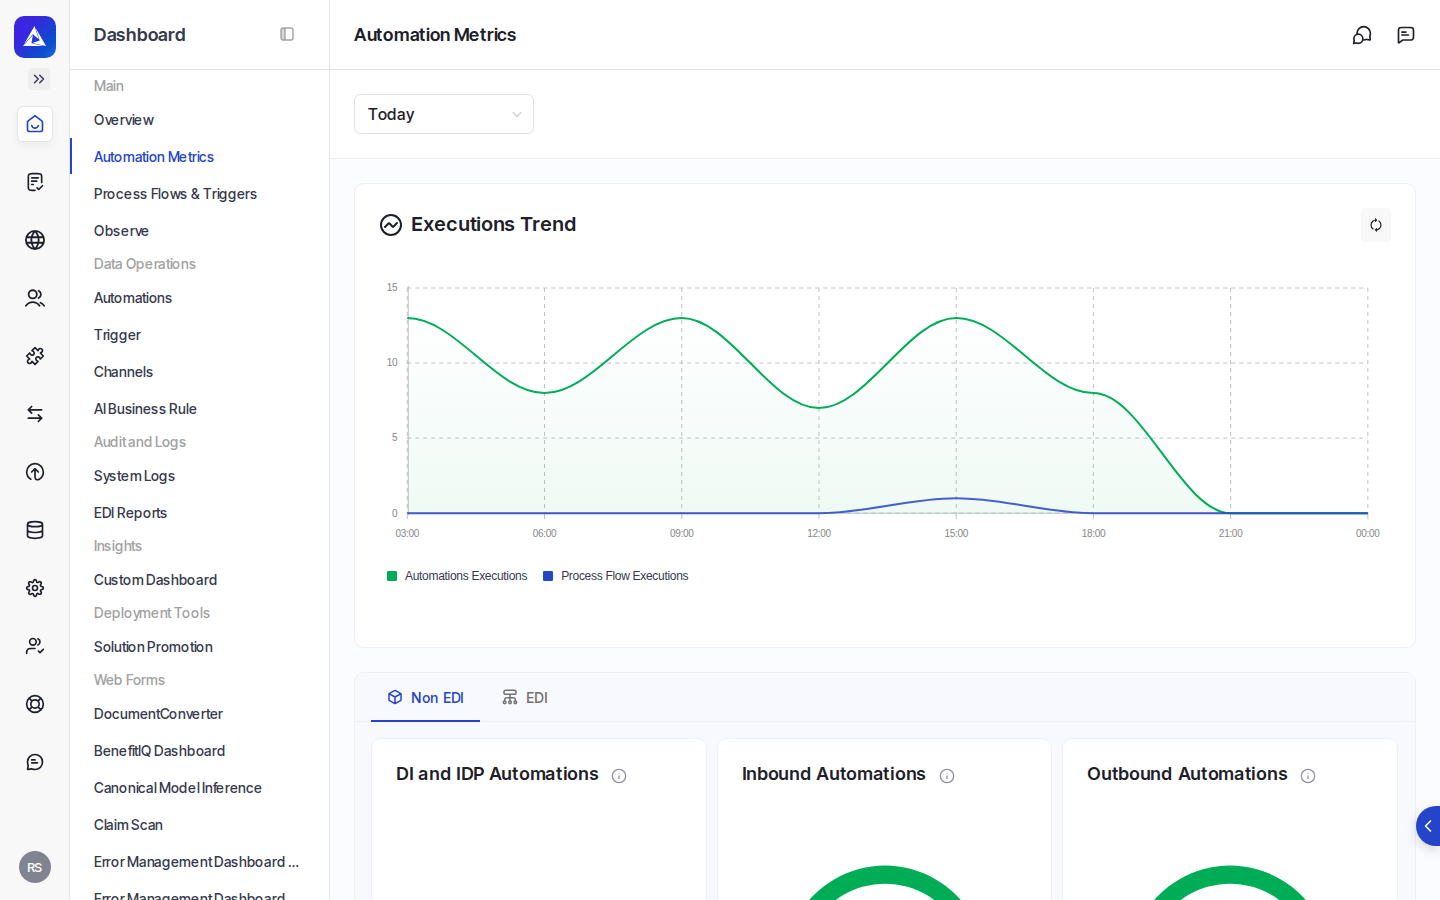
What you can see
The dashboard brings together several views of your automation activity:
| View | What it shows |
|---|---|
| Execution summary | Total counts of completed, pending, and failed runs for a selected time period |
| Trends | How execution volumes and outcomes have changed day by day |
| Completed runs | Integrations that finished successfully |
| Pending runs | Integrations that are still in progress |
| Transaction types | A breakdown of activity by the kind of integration |
| Process flows | Activity across your active workflows |
You can scope the execution overview to a specific date range and adjust the time zone to match your local context.
Tracking trigger and event activity
Alongside execution metrics, a dedicated trigger dashboard shows you what is firing and when. It covers:
| Section | What it shows |
|---|---|
| Daily trigger counts | How many times triggers fired each day over your chosen date range |
| Recently triggered processes | Which integrations were started by a trigger |
| Active triggers | Triggers that are currently enabled |
| Process errors | Failed integrations with their error messages |
| Trigger errors | Triggers that failed to fire, with error details |
This view is useful when you want to understand whether an integration failed to run at all (a trigger problem) versus ran but produced an error (an execution problem).
Browsing execution history
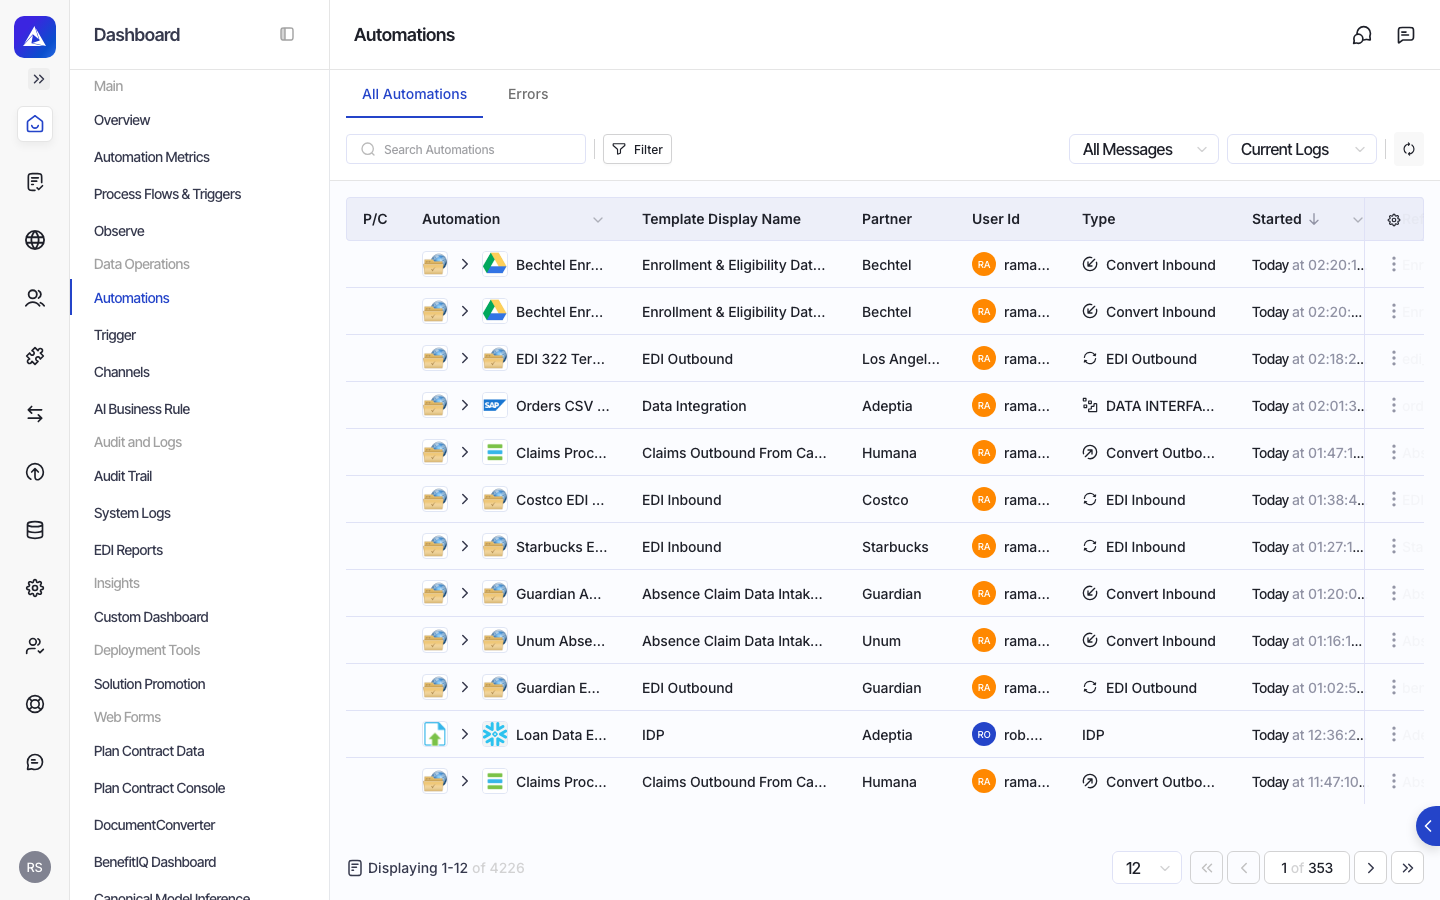
You can browse the full history of individual runs and filter by:
- Status: successful, failed, or currently running
- Integration or workflow name
- Partner or trading partner name
- Date range
Results are paginated so you can work through large volumes of history. You can also group failed runs by error message, integration name, or partner name to identify patterns, such as a single recurring error affecting many runs.
Investigating a specific run
Selecting an individual run opens a detailed view that breaks down what happened at each step, from the source system through any transformation logic to the destination. For each step you can see timing, data volumes, and, when something went wrong, the specific error message.
For deeper investigation, you can also pull up a full activity-by-activity audit trail showing exactly what each part of the pipeline did, and review any context variables that were in play during the run.
Reviewing configured automations
Beyond individual runs, you can browse the full list of configured automations (called transactions) in your environment. Each transaction represents a complete integration setup, linking a process flow to a partner, a trigger, and its settings. You can filter this list by status, type, partner, or a free-text search across names and descriptions.
Selecting a transaction shows you its full configuration: the source and destination applications, the partner it serves, the trigger that starts it, and the pipeline steps it runs through. This is useful for understanding how an integration is set up before you investigate why a run failed.
Why this matters
Having execution history, trigger activity, and configuration details in one place means you can move quickly from "something is wrong" to "here is exactly what failed and why," without switching between separate tools or waiting for a support escalation.