Dashboards & Analytics
The Adeptia Automate portal provides a dashboard that gives you an at-a-glance view of your integration activity, helping you monitor the health and performance of your automations and process flows without leaving the platform.
Where: Dashboard Tab
What the dashboard shows
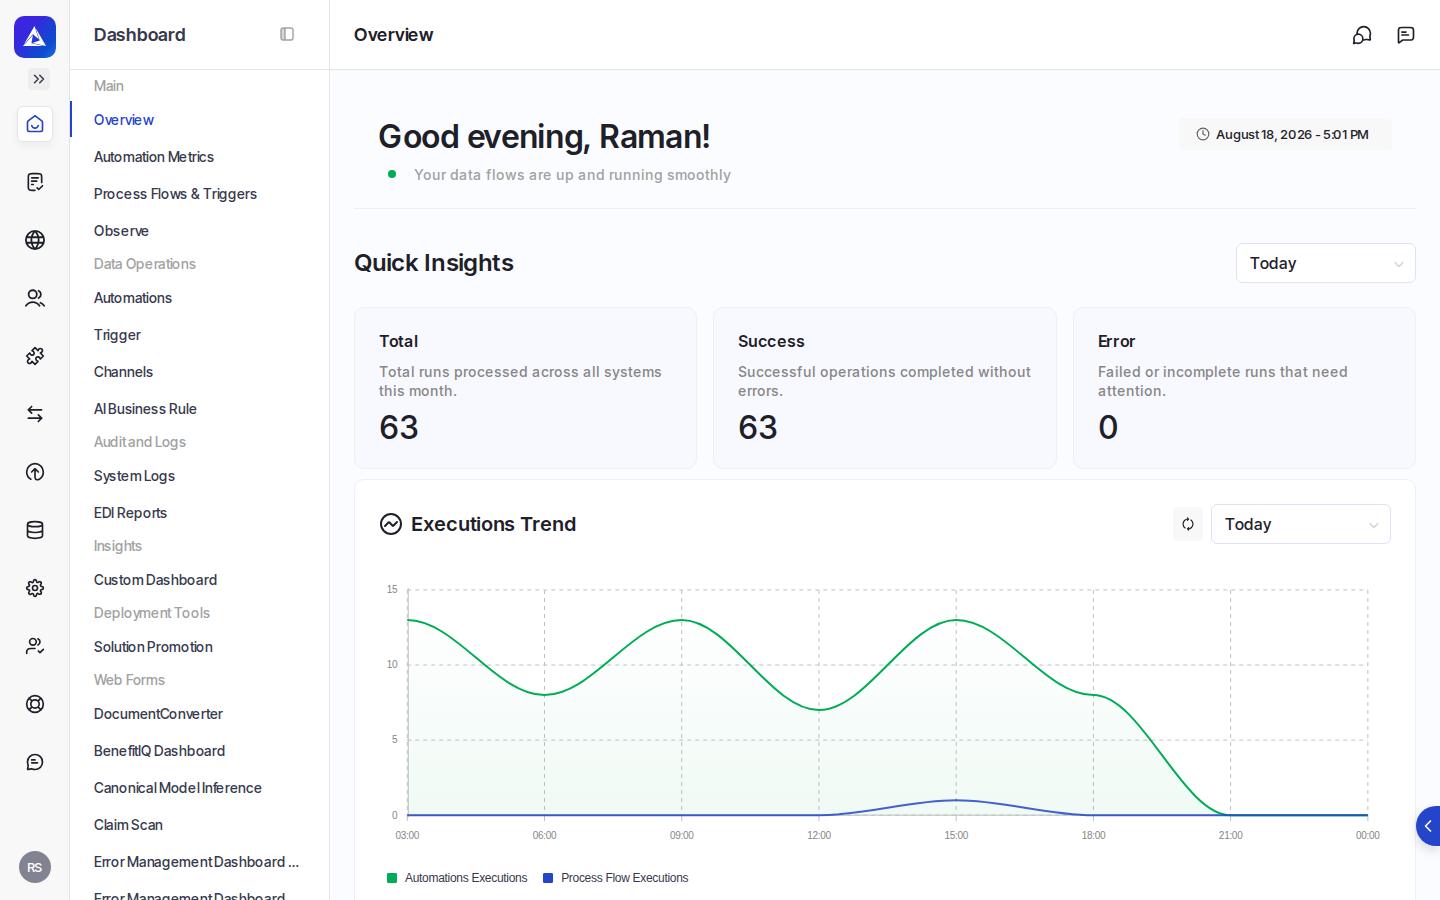
The dashboard aggregates execution data across your integrations into several distinct views, each focused on a different aspect of operational health.
| Section | What it tells you |
|---|---|
| Summary | Total executions across the selected time window, broken down into successful and failed runs, plus overall data usage |
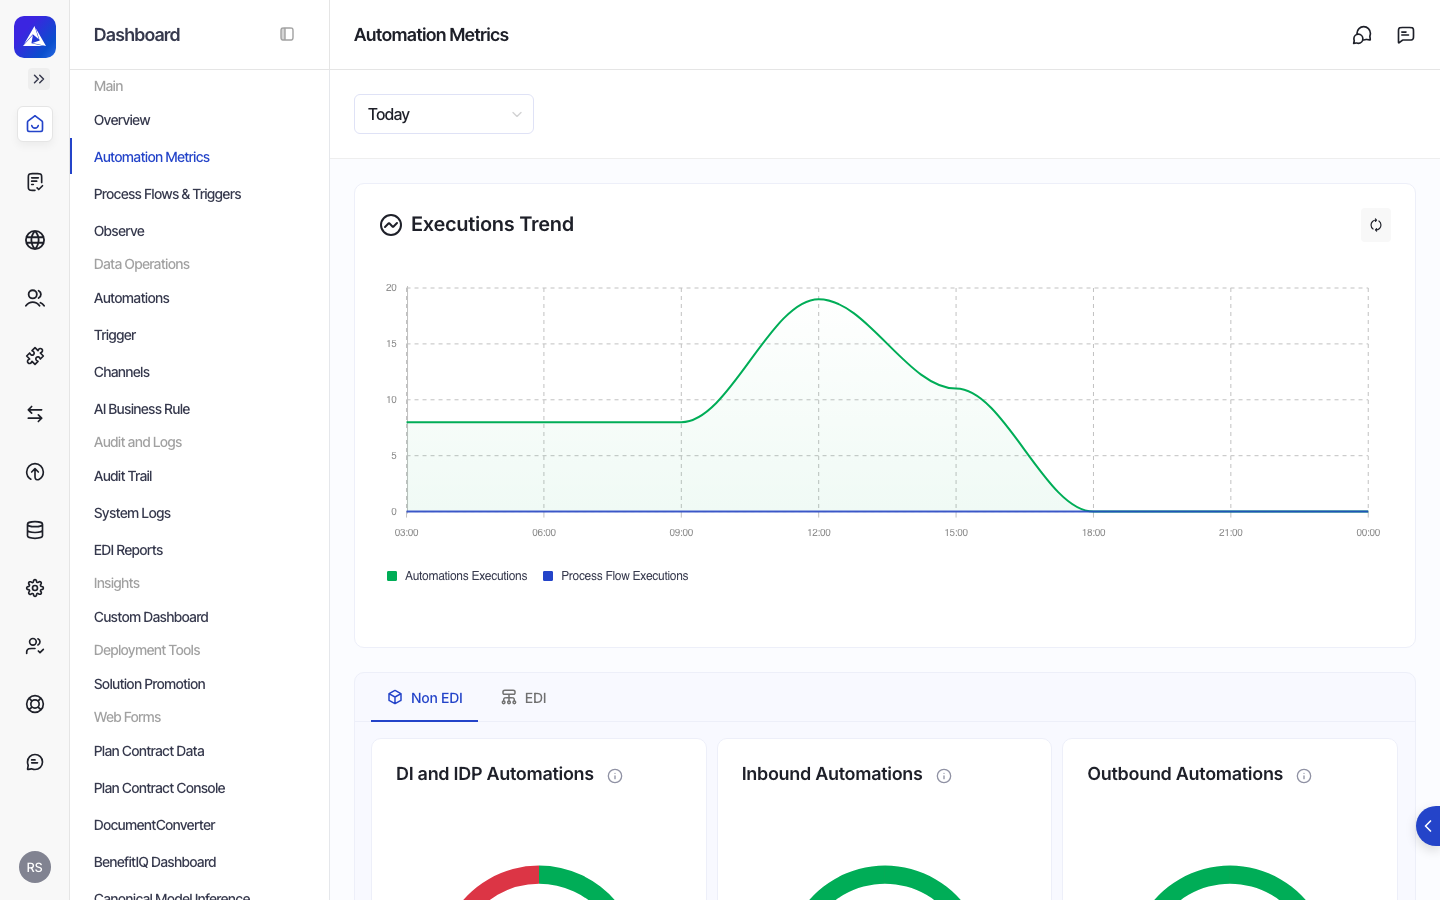
| Trends | How execution volume has changed over time, shown separately for automations and process flows |
| Completed executions | Counts of finished automation and process flow runs, split by success and failure |
| Pending executions | Counts of automation and process flow runs that are currently in progress or waiting in a queue |
| Transaction types | Success and failure counts organized by transaction direction and type, including EDI inbound, EDI outbound, inbound, outbound, VAN, and My Connection |
| Process flow activity | Daily execution counts for your process flows over the selected time window |
Why it is useful
The dashboard gives integration owners and operations teams a single place to answer common questions:
- Are my automations running successfully, or are failures spiking?
- How much data is flowing through my integrations?
- Are any runs stuck in a queue or still running longer than expected?
- Which transaction types, such as EDI or VAN, are experiencing the most failures?
Because the dashboard covers both automations and process flows together, you can compare activity across different integration styles without switching between separate monitoring tools.
Partial results and resilience