Centralized monitoring
Adeptia Connect allows you to monitor the system and its execution environment holistically by using monitoring tool. You can use Prometheus and Grafana for monitoring the Adeptia Connect resources. The image given below depicts how Prometheus and Grafana are used with Adeptia Connect for monitoring functions.
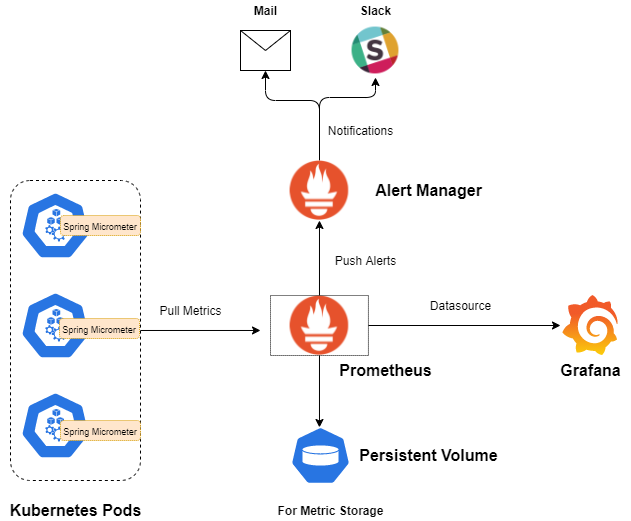
How Prometheus and Grafana work
-
Using Micrometer framework, Adeptia exposes the application metrics over an HTTP/s URL in the Prometheus format that can be scraped by Prometheus.
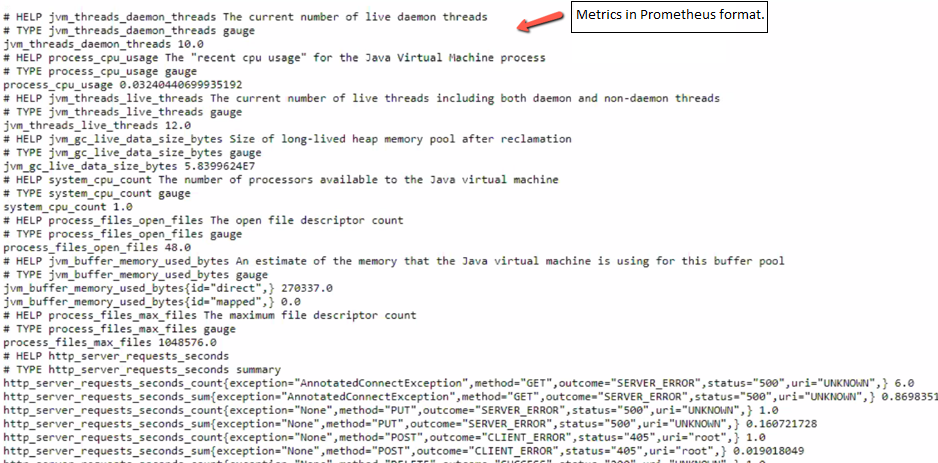
Application metrices in Prometheus formatPrometheus tool can be configured to pull the metrics periodically and store data. You can also configure rules in the Prometheus tool that are evaluated periodically and can send alerts to Alert Manager (in Prometheus) to send out notifications via methods such as email, Slack, etc.
-
Grafana allows visualizing the data stored in Prometheus through flexible dashboards.
You can monitor the activities including transactions, triggers, process flows, audit trail, etc. on the dashboard.
 | The metrices exposed by Adeptia Connect Microservices are in Prometheus format only. |
Below is the list of URLs exposed by Microservices.
- portal: <URL of portal service>/prometheus
- runtime: <URL of runtime service>/runtime/prometheus/
- webrunner: <URL of webrunner service>/adeptia/prometheus/
- event: <URL of event service>/event/prometheus/
- license: <URL of license service>/license/prometheus/
- archival-and-cleanup: <URL of archival-and-cleanup service>/archivalandcleanup/prometheus
- api-gateway: <URL of api-gateway service>/prometheus
- webapp-gateway: <URL of webapp-gateway service>/prometheus
- aimap: <URL of aimap service>/prometheus
- listener: <URL of listener service>/listener/prometheus
- soap-api: <URL of soap-api service>/prometheus
- rest-api: <URL of rest-api service>/rest/prometheus
| You can configure Prometheus and design Grafana dashboard to view the metrices you need. Refer the Prometheus and Grafana documentation to achieve this. |