Viewing Process Flow logs
The Process Flow log displays all the details about the process flow execution and its associated activities. It also displays the status of the associated (Parent or Child) Process Flow.
This document contains the following sections:
Accessing Process Flow logs
-
Go to the Dashboard page.
-
Click Transactions icon from the left pane.
-
Click All Messages drop-down list and select Process Flow. By default, the system displays current day logs.
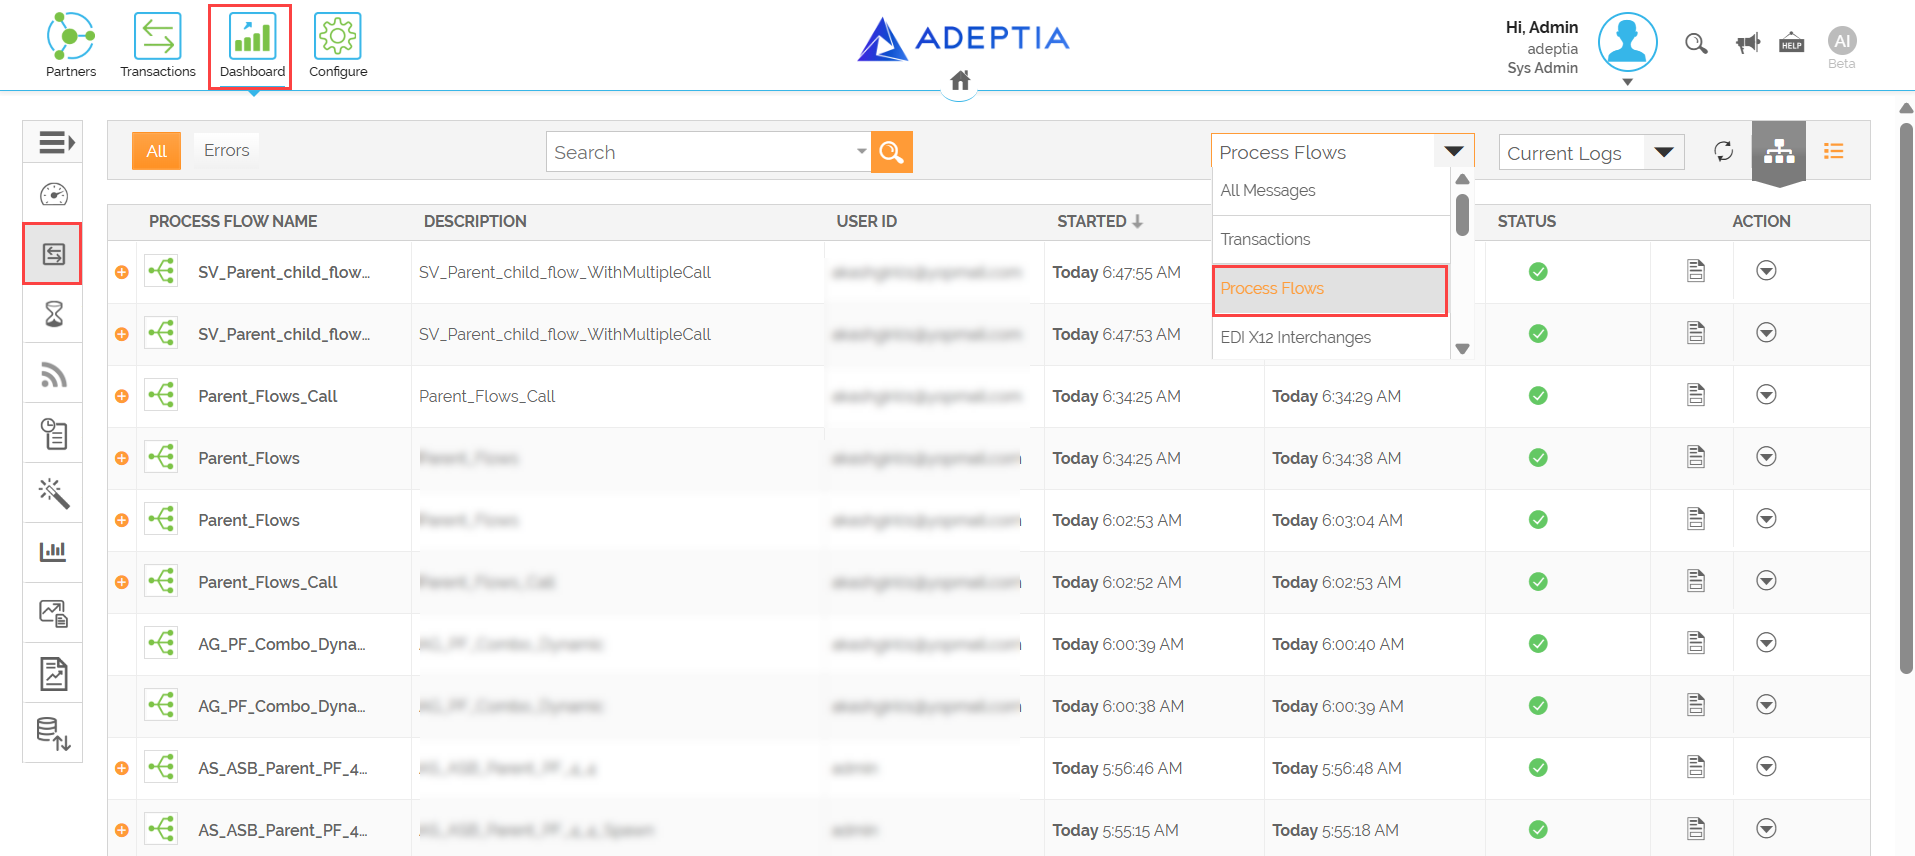

- You can also filter the data based on current logs and archived logs.
- You can see all the Process Flow logs by clicking All. To see the Process Flows which have errors in execution, click Errors.
- You can also select the view mode for Process Flow logs by selecting the List or Tree options based on your requirement. To configure the default view mode, refer to Dashboard view mode section in this page.
The Process Flow log information is displayed. The following table provides descriptions for the columns on the page:
Description P/C Indicates the Process Flow type: P = Parent, C = Child, PC = Both Parent and Child. This column is available in the Transaction details table only when you select List view. PROCESS FLOW NAME The name of the Process Flow. DESCRIPTION Description of the Process Flow. USER ID Name of the user who last activated the Process Flow.
NODE NAME The name of the node on which the Process Flow gets executed in a clustered environment. STARTED
Date and time when the execution of the Process Flow started. END TIME Date and time when the execution of the Process Flow completed. PROCESS INSTANCE ID A unique identifier for a specific execution instance of the Process Flow. STATUS The status of the Process Flow execution. The status can be: Execution successful, Queued, Error in Execution. ACTION  : View details of the execution.
 : You can access the additional details about the Process Flow by clicking on More option. For more details, refer to this section.
 -
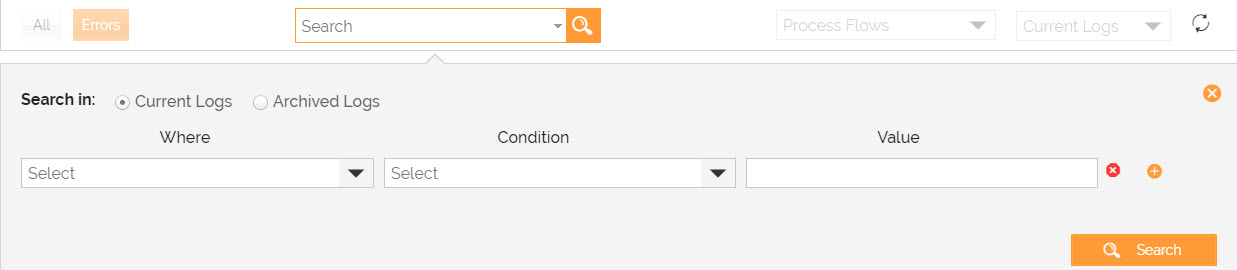
To search for specific Process Flow logs use the Search or Advanced Search options. To perform an Advanced Search do the following:
-
Click Advanced Search
 from the search box.
-
Select either Current Logs or Archived Logs option.
-
Provide the Where, Condition with values and click Search to fetch Process Flow Log results for a specific entity.
-
Click Search.
-
Accessing additional details of Process Flows
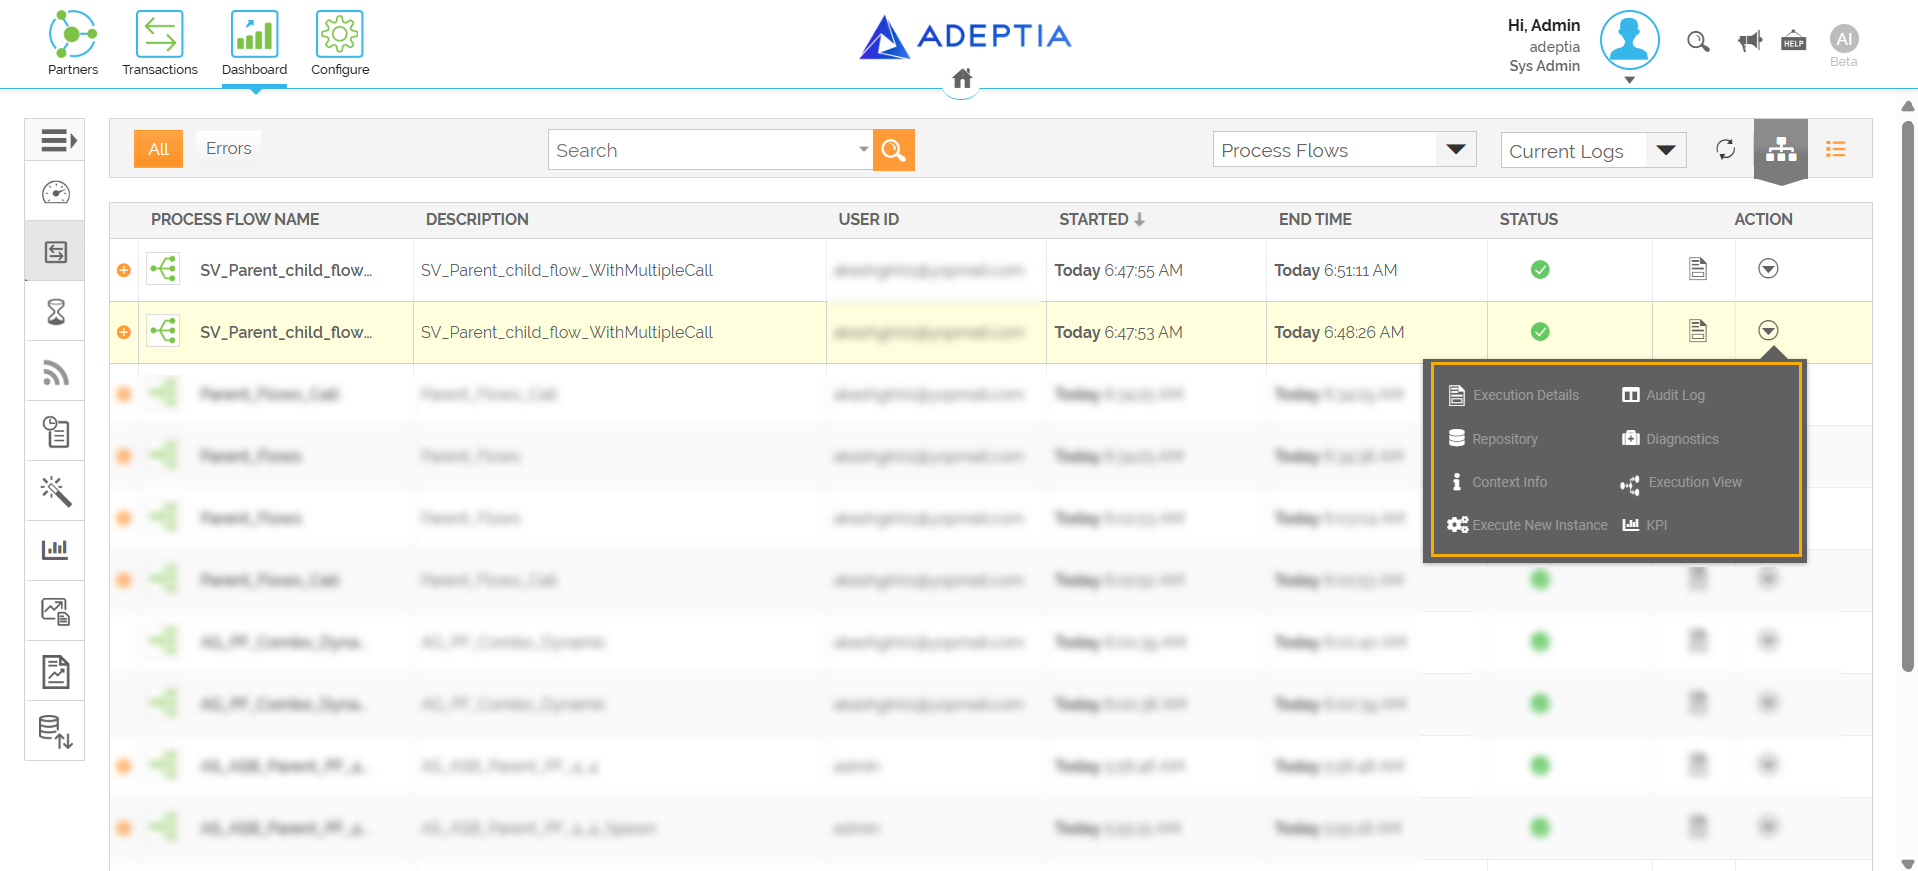
You can access the additional details about the Process Flow by going to the following options under Action menu:
-
To view intermediate repository files of a Process Flow, click Repository. A new browser tab opens with the list of repository files created during execution of the Process Flow.
- To open any file from the list, click the name of the file.
- To set a particular character set encoding to be applied when the respective intermediate repository files of the process flow are opened, define the required character set encoding code in the new textbox marked as Character Set Encoding. All the repository files will then support the defined character set encoding.
-
To view the detailed log for Process Flow log levels other than ERROR*,* click Diagnostic. Depending on the log level, the detailed log of this process flow opens in a new browser window Process Flow Diagnostics.
- Clicking the Error link displays the details of all errors that caused the process flow to abort. This Error link is displayed in the View Process Flow Log screen, only if the Process Flow is aborted. If Process Flow executes successfully, this Error link is not displayed.
- Click Close Window to close this screen.
-
To view the details of the execution of a Process Flow, click Execution Details.
-
To view the value of the context variables used in the process flow, click Context Info.
-
To view the execution of a Process Flow, click Execution View. Click here for more details.
-
To execute a new instance of a Process Flow, click Execute New Instance. The Process Flow will be submitted to Queue Processor for execution.
-
To view the information about all process variables defined (for all parent and child process flows) for all instances of the selected process flow, click KPI. It displays the instance name of the parent flow (or overridden description, if it is overridden by the developer at design time). This screen is divided into two parts:
-
- Search Criteria
- Process Variable Data
-
You can search for process flows and their variables, based on the date and time range by clicking the
 in the upper right corner of the screen. This displays the date and time range fields. Enter the date range and enter the time in the respective fields. Once done, click Apply. This displays the process flows and their process variable details conforming to the specified time range.
 -
Alternately, search for process flows and their variables, based on the Process Variable search criteria. Select the process variable name that you want to search, from the Select drop-down list. Then, enter some search criteria (such as name of variable) in the text field, click Search. This displays the process flow(s) with the specified process variable.
You can enter wildcards in the search criteria text field.
This screen will show the last updated value of the process flow variable.
-
You can click the Instance Name link to view the instance details.
-
-
Select Parent/Child Info to view detailed information about the associated Process Flows, based on your selection.
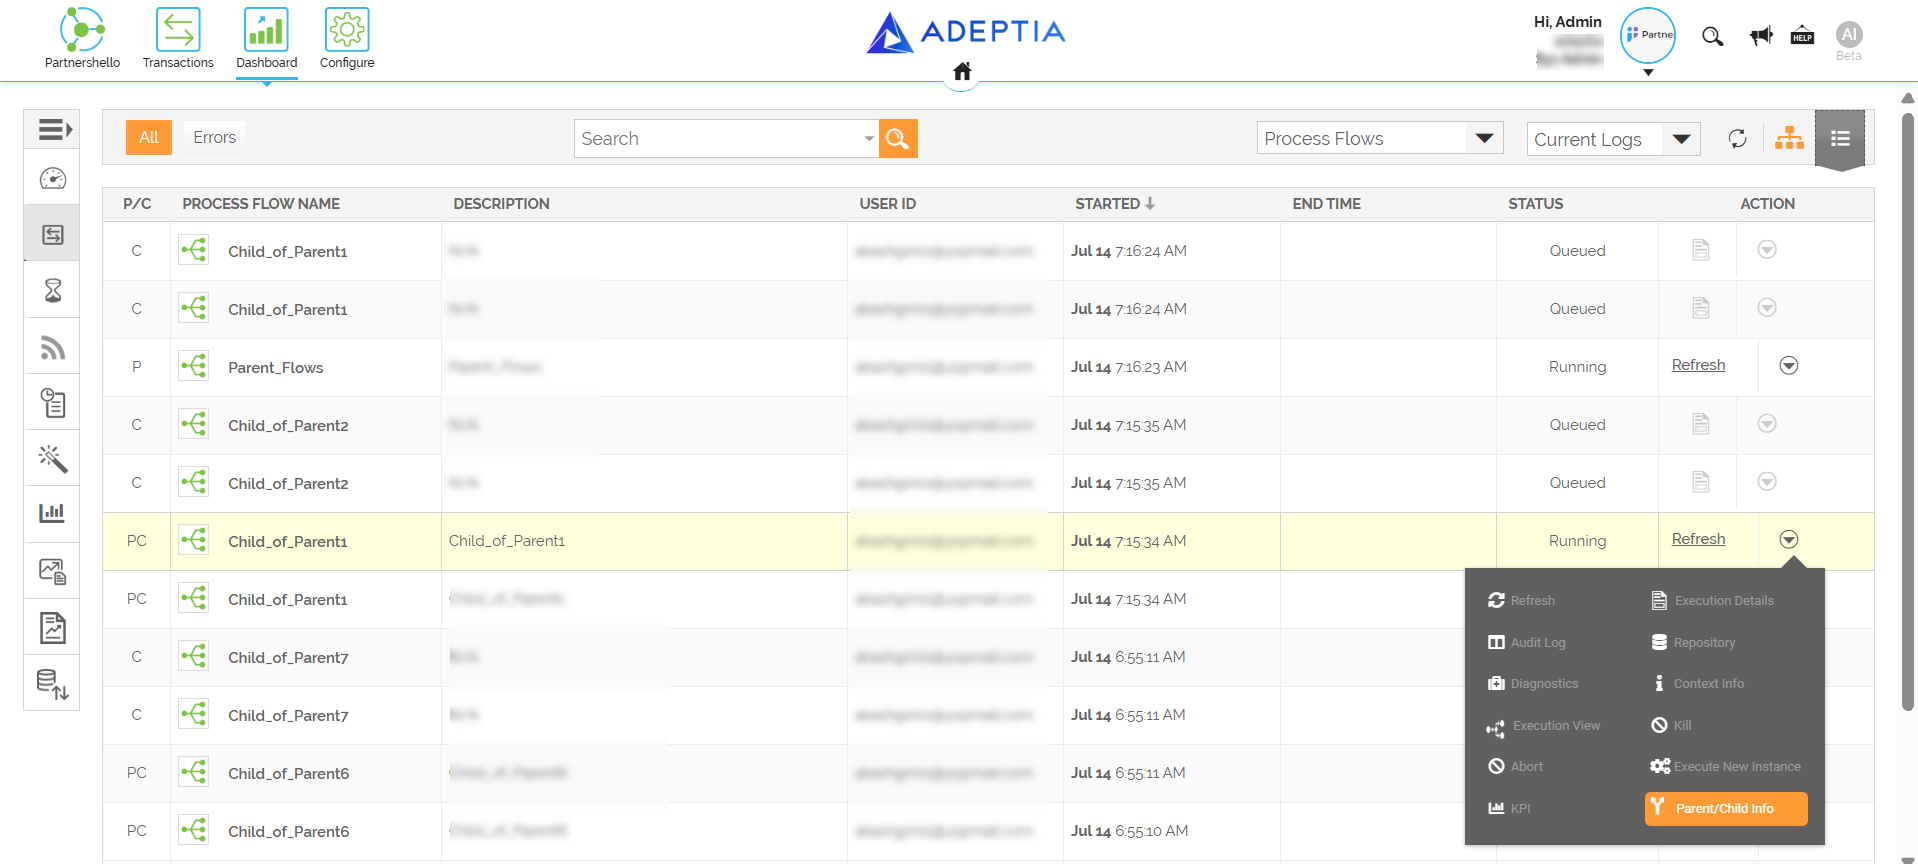
If you select:-
A child (C) flow, you can view the details of the associated parent Process Flow.
-
A parent (P) flow, you can view the details of the associated child Process Flow.
-
If you select a Parent/Child (P/C) flow, you can view details of both the parent and child Process Flows.
This option is available only when you view the Process flow logs in List view. 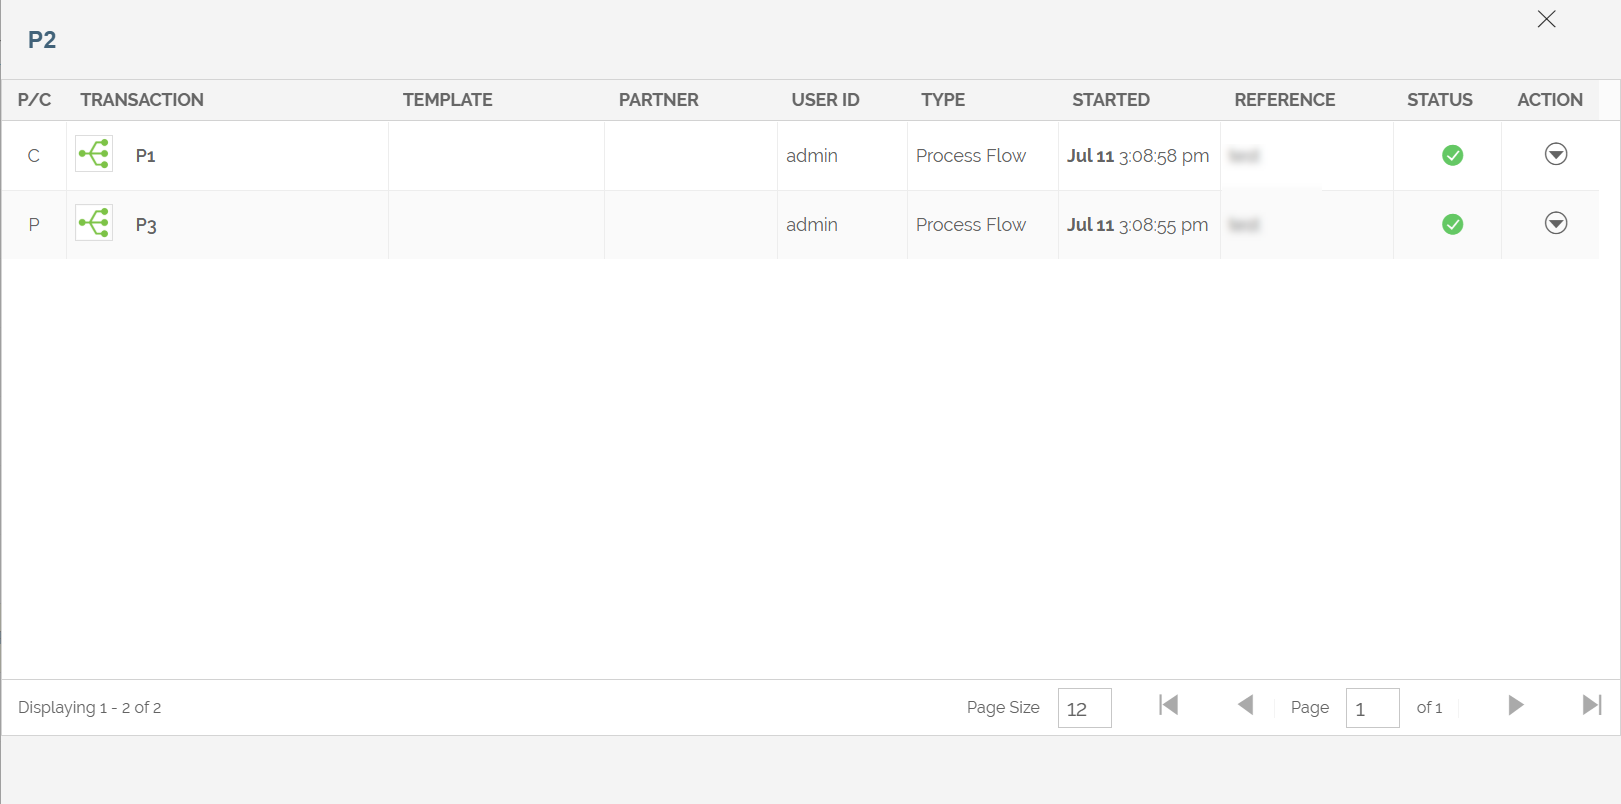
-
 | When a process flow is in running state, you get two options to terminate it. At any time, you can Kill or Abort a process flow. Abort: This action aborts the process flow instantly whenever the execution of currently running service is complete. |