System Console
System Console provides you with a list of information related to the status of Adeptia Connect. It also helps to diagnose the errors that may have occurred while using Adeptia Connect.
Steps to access the System Console page:
- Go to Account > Tools > System Console.
The System Console page is displayed.
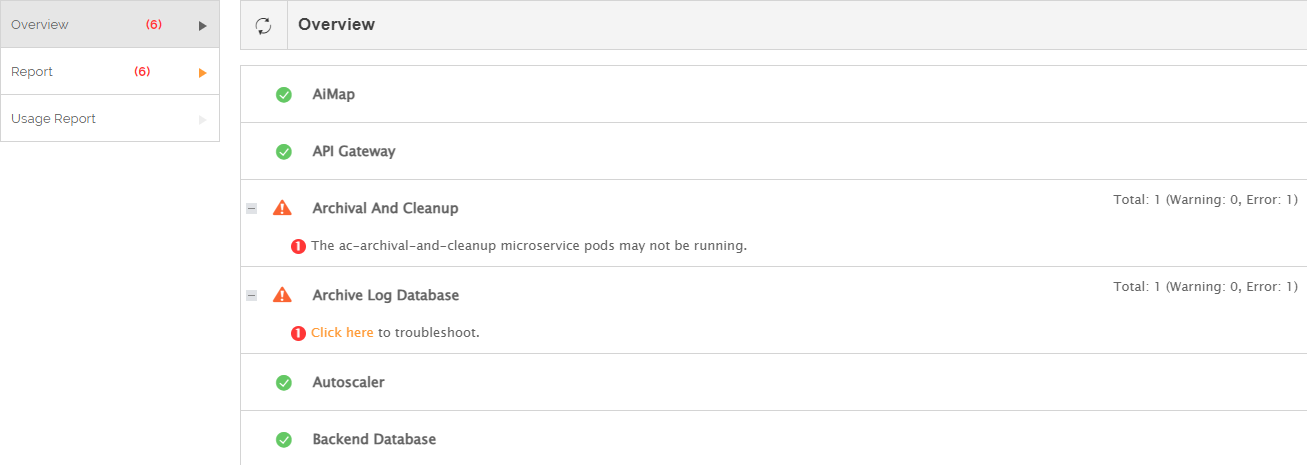
The System Console page helps you diagnose the errors occurring while using Adeptia Connect.
There are three types of information you can view in System Console:
Overview
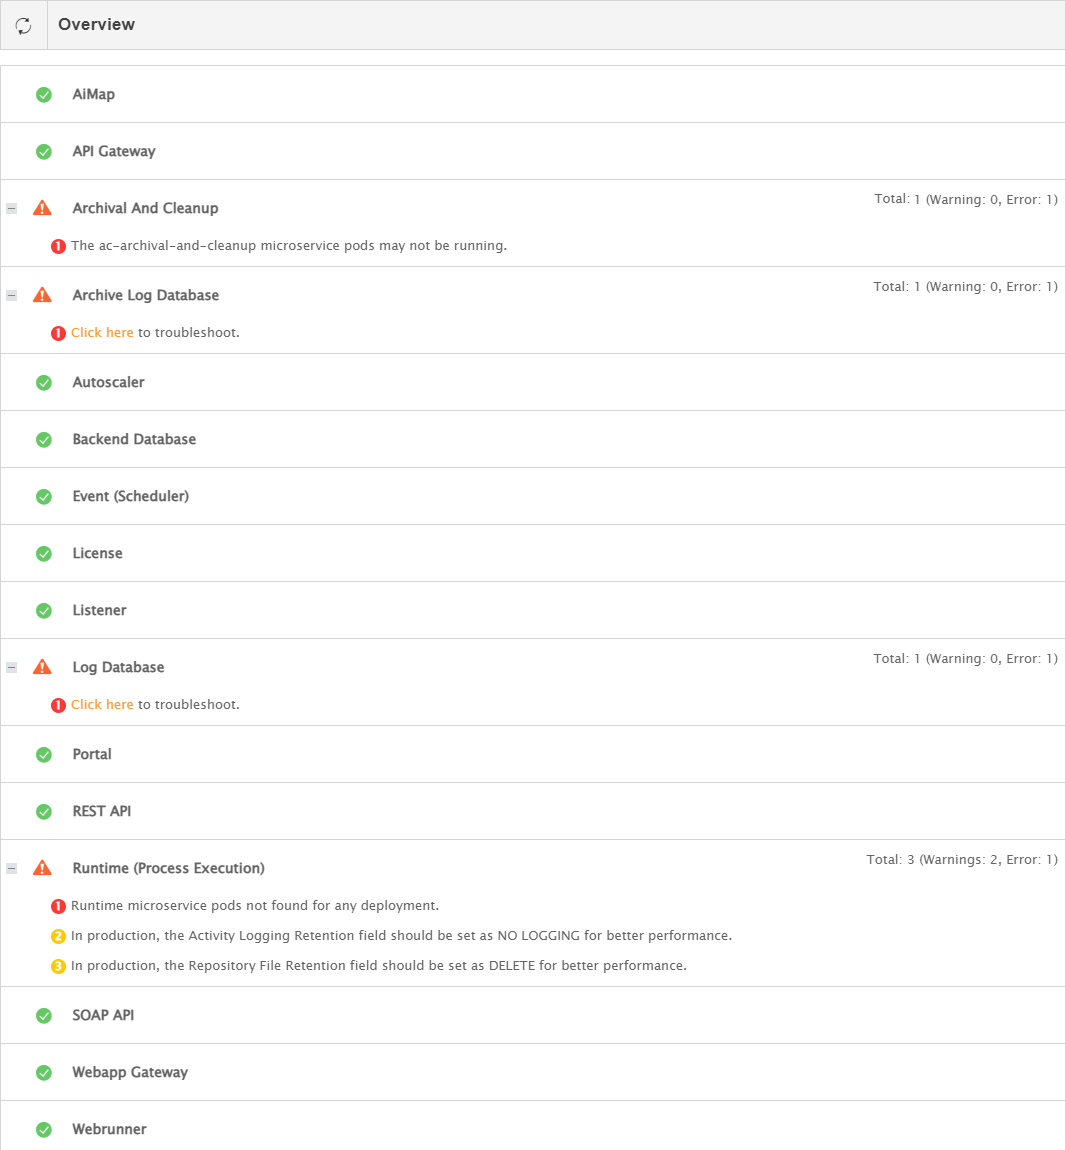
"Overview" shows an overview of microservices and the databases including their status and details based on different monitoring parameters.
| Icon | Description |
|---|---|
 | Execution is successful. |
| Warning when execution is partially completed. |
| Errors while execution. |


Report
"Report" displays the status (Running/Stopped), Number of Pods Running, and Image Tag for each microservice and database connection availability with errors and warnings. You can also click  to download the detailed report of each microservice in JSON format.
 | For license microservice you will be able to see the additional details based on the following five criteria by clicking View in the Details row:
For runtime microservice, you can also view the following details about all the deployments by clicking View in the Deployment Information row:
|
Usage Report
To know more about the Usage Report details, click here.
Adding button to access external monitoring tool
You can add and configure a button to navigate to an external monitoring tool you may be using for monitoring purposes. The added button is displayed in the Overview and the Report sections of the System Console. Follow the steps given below to add and configure the button.
-
Go to Account > Settings.
-
Expand Application Settings, and then select Common in the left panel.
-
Expand the property category, Monitoring Tool Configuration and set the following properties**.**
Property Name Description monitoring.tool.button.text Property to provide a name to the button.

It is mandatory to enter a name for the button in this field to make the button visible. monitoring.tool.button.tooltip
Property to provide a tooltip for the button.
No tooltip is displayed if you leave this field blank. monitoring.tool.url
Property to set the URL for the external monitoring tool. Leaving this field blank displays the message "URL is not configured. Please configure the URL in "monitoring.tool.url" property" when you click the button.
-
Click Update to save the changes.
To get the changes into effect, you need to reload the browser window.
The navigation button is displayed at the top-right corner in both the Overview and Report sections. Clicking the button navigates you to the external monitoring tool.
Downloading the Image Tags
You can download the Image Tags of all microservices by following the steps given below.
- In the top pane, click**
 > About**.
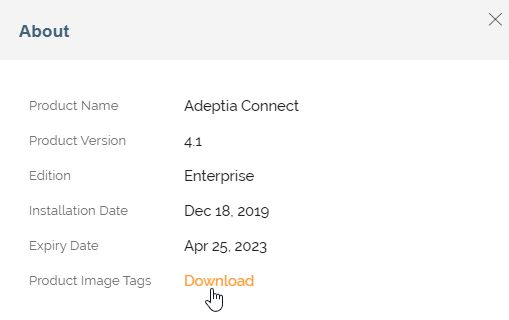
 - In the About window, click Download to download the microservices' Image Tags.