Dashboard
The Dashboard in AI Business Rules is a powerful tool for monitoring both rules and rule sets. It offers detailed insights into various aspects of each rule and rule set, helping you manage and optimize them effectively.
To open the Dashboard,
- In the Adeptia Connect application, go to the Dashboard menu.
- On the left panel, select AI Business Rules, and then click on Let's Get Started.
You will be redirected to the AI Business Rules Dashboard.
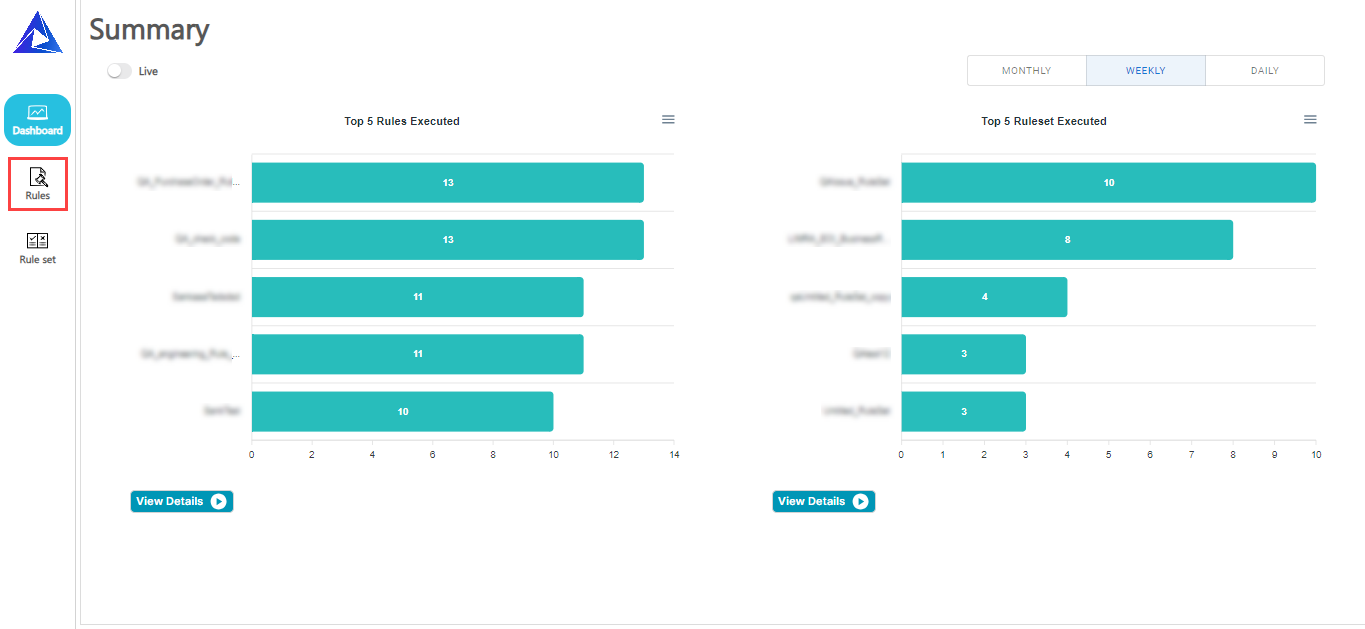
The AI Business Rules Dashboard contains the following sections:
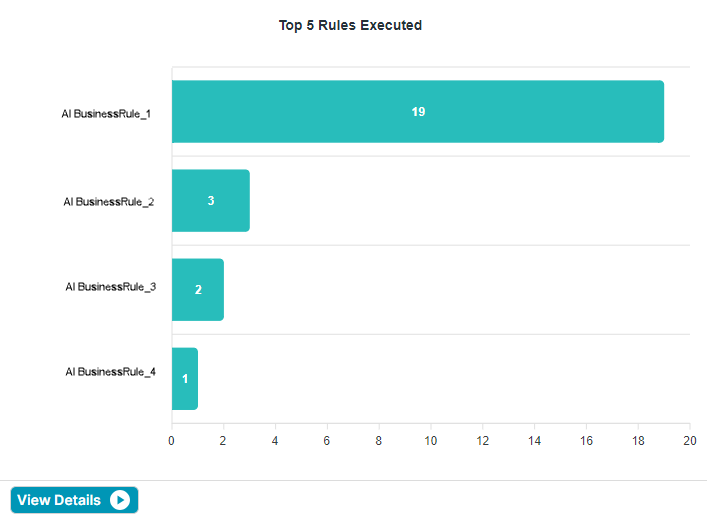
Top 5 Rules Executed
This section presents a graphical representation of the most frequently executed rules within a specified time frame. The graph highlights the top-performing rules, offering quick insights into which rules are most active and potentially impacting your operations the most.
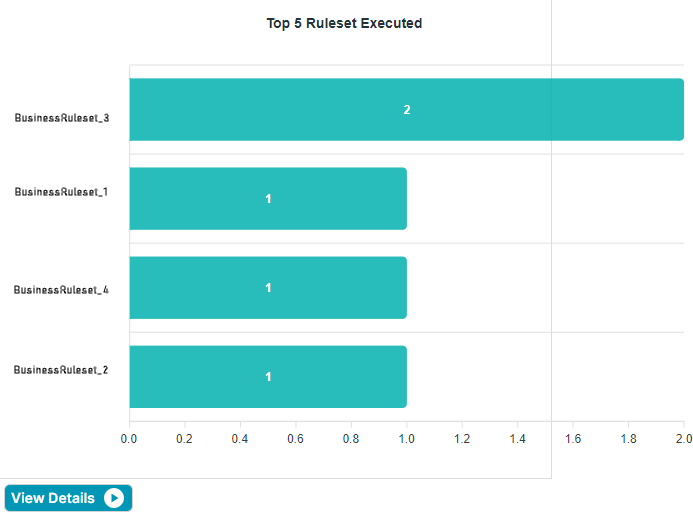
Top 5 Rulesets Executed
This section presents a graphical representation of the most frequently executed rule sets within a given timeframe. This chart helps you quickly identify which rule sets are most active, allowing you to analyze and optimize accordingly.
 |
View Details
You can access the execution details of rules or rulesets by selecting the View Details option under the corresponding graphs.
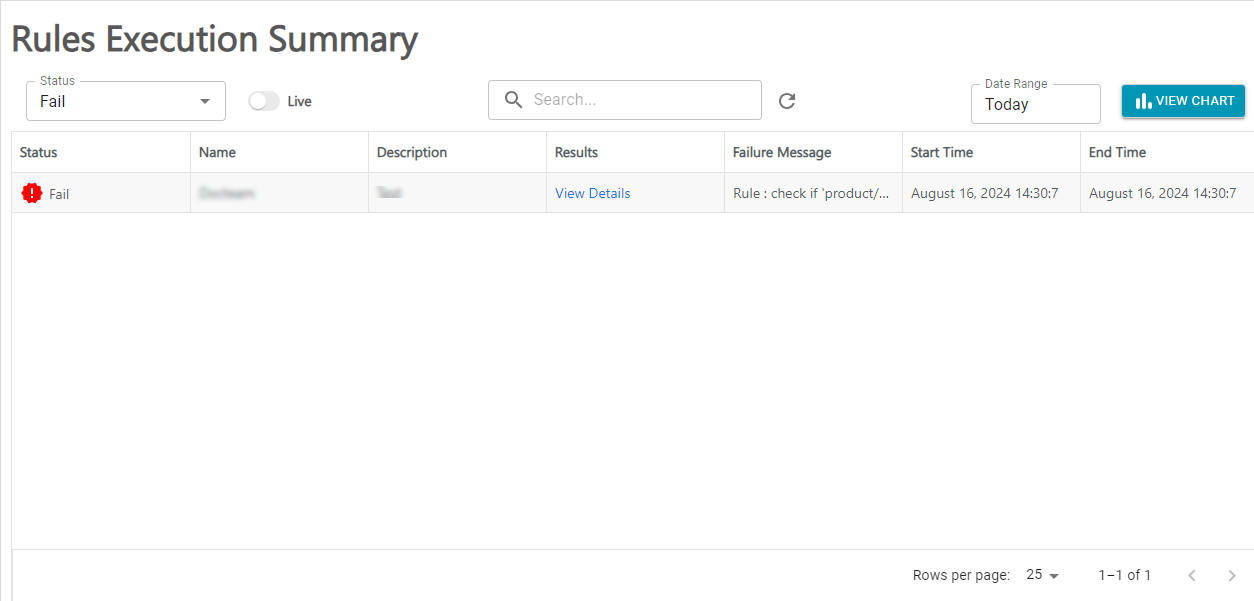
Rules Execution Summary
Selecting the View Details option displays the Rules Execution Summary page that contains the execution details of all the rules, as illustrated in the screenshot below.
|
|
Ruleset Execution Summary
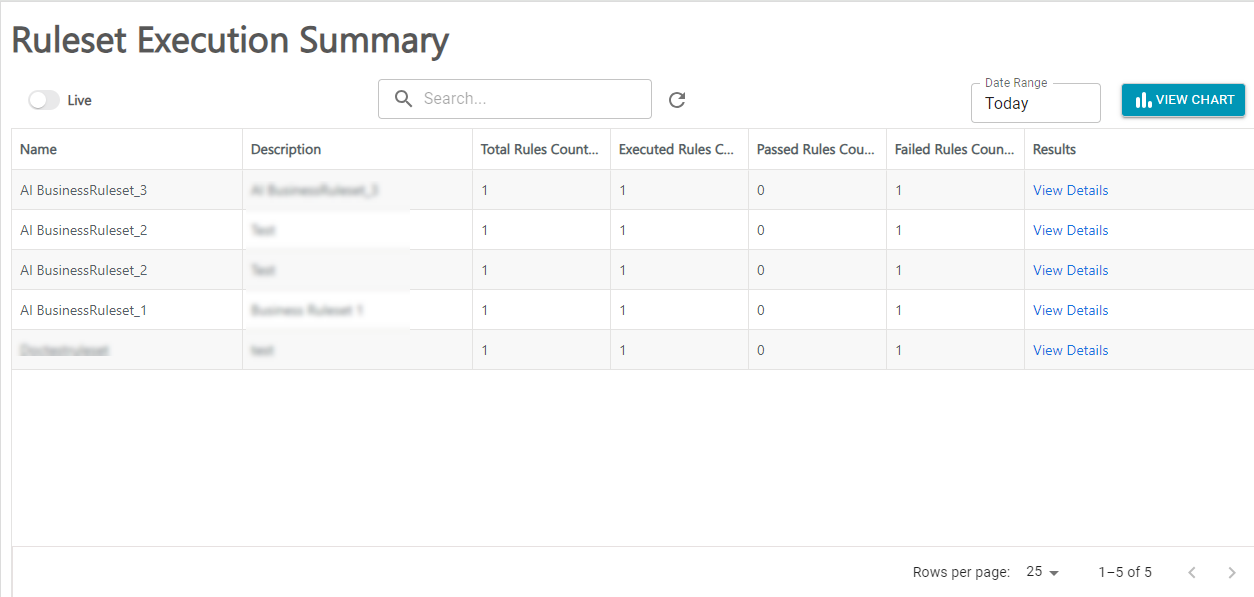
Selecting the View Details option displays the Ruleset Execution Summary page that contains the execution details of all the rule sets, as illustrated in the screenshot below.
|
|