Creating a Dashboard Component
A Dashboard Component can be created using one of the following:
- Bar Chart
- String Chart
- Table Chart
- PIE Chart
Prerequisites
 | You must create a Database Info service before you proceed to create a dashboard component. |
Creating a Bar Chart
-
Click Configure > CUSTOM DASHBOARD > Component.
-
Click Create Custom Dashboard Component.
-
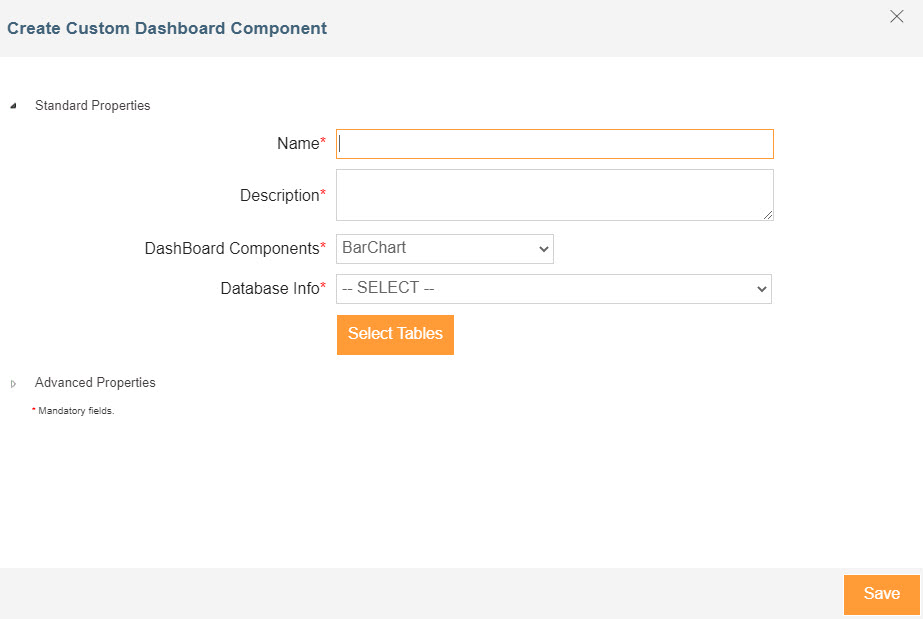
Enter the name and description of the new dashboard component in the Name and Description fields respectively.
-
Select Bar Chart from the Dashboard Component field.
-
Select the Database Info which you want to use from the Database Info field.
-
Click Select Tables.
-
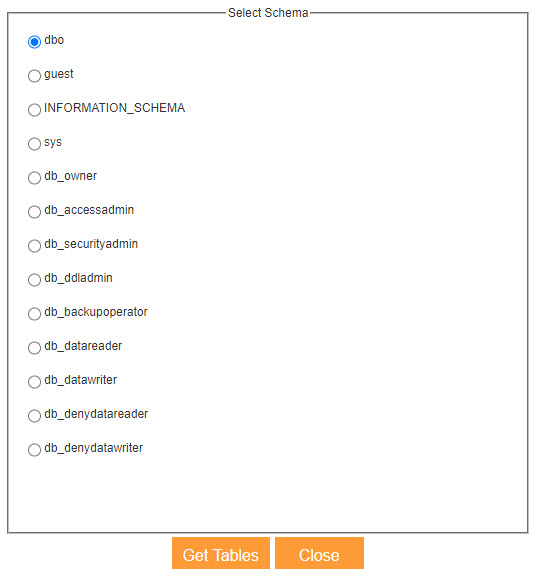
On Select Schema screen:
-
Select the required schema and click Get Tables.
-
Select the table and click Get Columns.
-
-
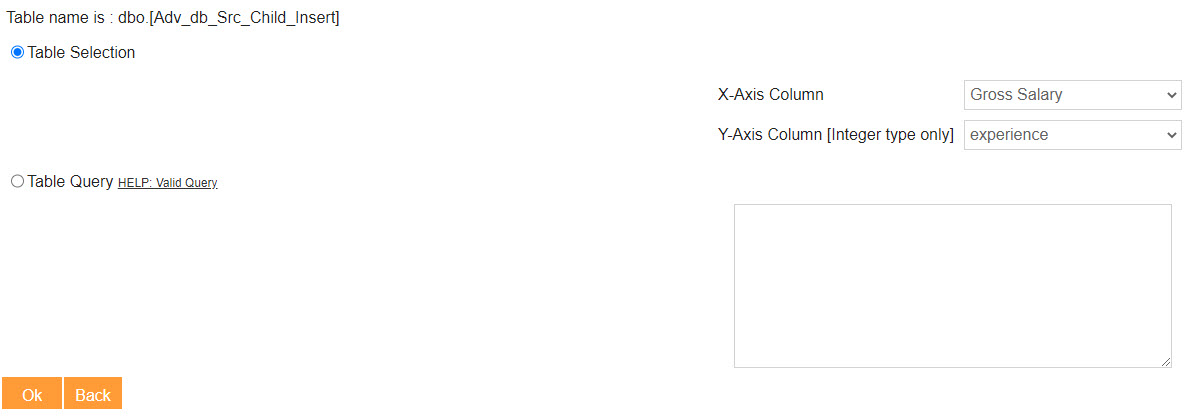
Select the X-Axis and Y-Axis components for the Bar Chart from the X-Axis Column and Y-Axis Column [Integer type only] fields respectively.
In Bar Chart Component Y-Axis can take only integer values or values which could be evaluated to an integer e.g. a string with value "2". Any other value will cause erroneous behavior.
You can write, SQL query to define X axis and Y axis of Bar chart. To write the SQL query, select Table Query and enter your query in the blank field. -
Click OK.
-
Expand Advanced Properties and then select the project from Project field.
-
Click Save.
Creating a String Chart
-
Click Configure > CUSTOM DASHBOARD > Component.
-
Click Create Custom Dashboard Component.
-
Enter the name and description of the new dashboard component in the Name and Description fields respectively.
-
Select String Chart from the Dashboard Component field.
-
Select the Database Info which you want to use from the Database Info field.
-
Click Select Tables.
-
On Select Schema screen:
-
Select the required schema and click Get Tables.
-
Select the table and click Get Columns.
-
-
Click Select All to select all the columns from specified table or click individual column name and write the simple Select query with Comma (,) separated column names.
-
Click OK.
-
Expand Advanced Properties and then select the project from Project field.
-
Click Save.
Creating a Table Chart
-
Click Configure > CUSTOM DASHBOARD > Component.
-
Click Create Custom Dashboard Component.
-
Enter the name and description of the new dashboard component in the Name and Description fields respectively.
-
Select Table Chart from the Dashboard Component field.
-
Select the Database Info which you want to use from the Database Info field.
-
Click Select Tables.
-
On Select Schema screen:
-
Select the required schema and click Get Tables.
-
Select the table and click Get Columns.
-
-
Click Select All to select all the columns from specified table or click individual column name and write the simple Select query with Comma (,) separated column names.
-
Click OK.
-
Expand Advanced Properties and then select the project from Project field.
-
Click Save.
Creating a PIE Chart
-
Click Configure > CUSTOM DASHBOARD > Component.
-
Click Create Custom Dashboard Component.
-
Enter the name and description of the new dashboard component in the Name and Description fields respectively.
-
Select PIE Chart from the Dashboard Component drop-down list.
-
Select the Database Info which you want to use from the Database Info drop-down list.
-
Click Select Tables.
-
On Select Schema screen, select the required schema and click Get Tables.
-
On Select Table screen, select the table and click Get Columns.
-
Select the X-Axis and Y-Axis components for the Bar Chart from the drop-down lists X-Axis Column and Y-Axis Column [Integer type only] respectively.
In Bar Chart Component Y-Axis can take only integer values or values which could be evaluated to an integer e.g. a string with value "2". Any other value will cause erroneous behavior.
You can write, SQL query to define X axis and Y axis of Bar chart. To write SQL query, click Table Query radio button and enter your query in the Table Query field. -
Click OK.
-
Expand the Advanced Properties and select the project from the Project drop-down list.
-
Click Save.